A “building” on a map can mean very different things. Sometimes it is a flat footprint polygon; sometimes a block extruded to a guessed height; sometimes a faithful model with a real roof shape. This post walks through how we get from raw imagery to a clean, attributed LoD2 model — the level of detail most cities and planners actually need.
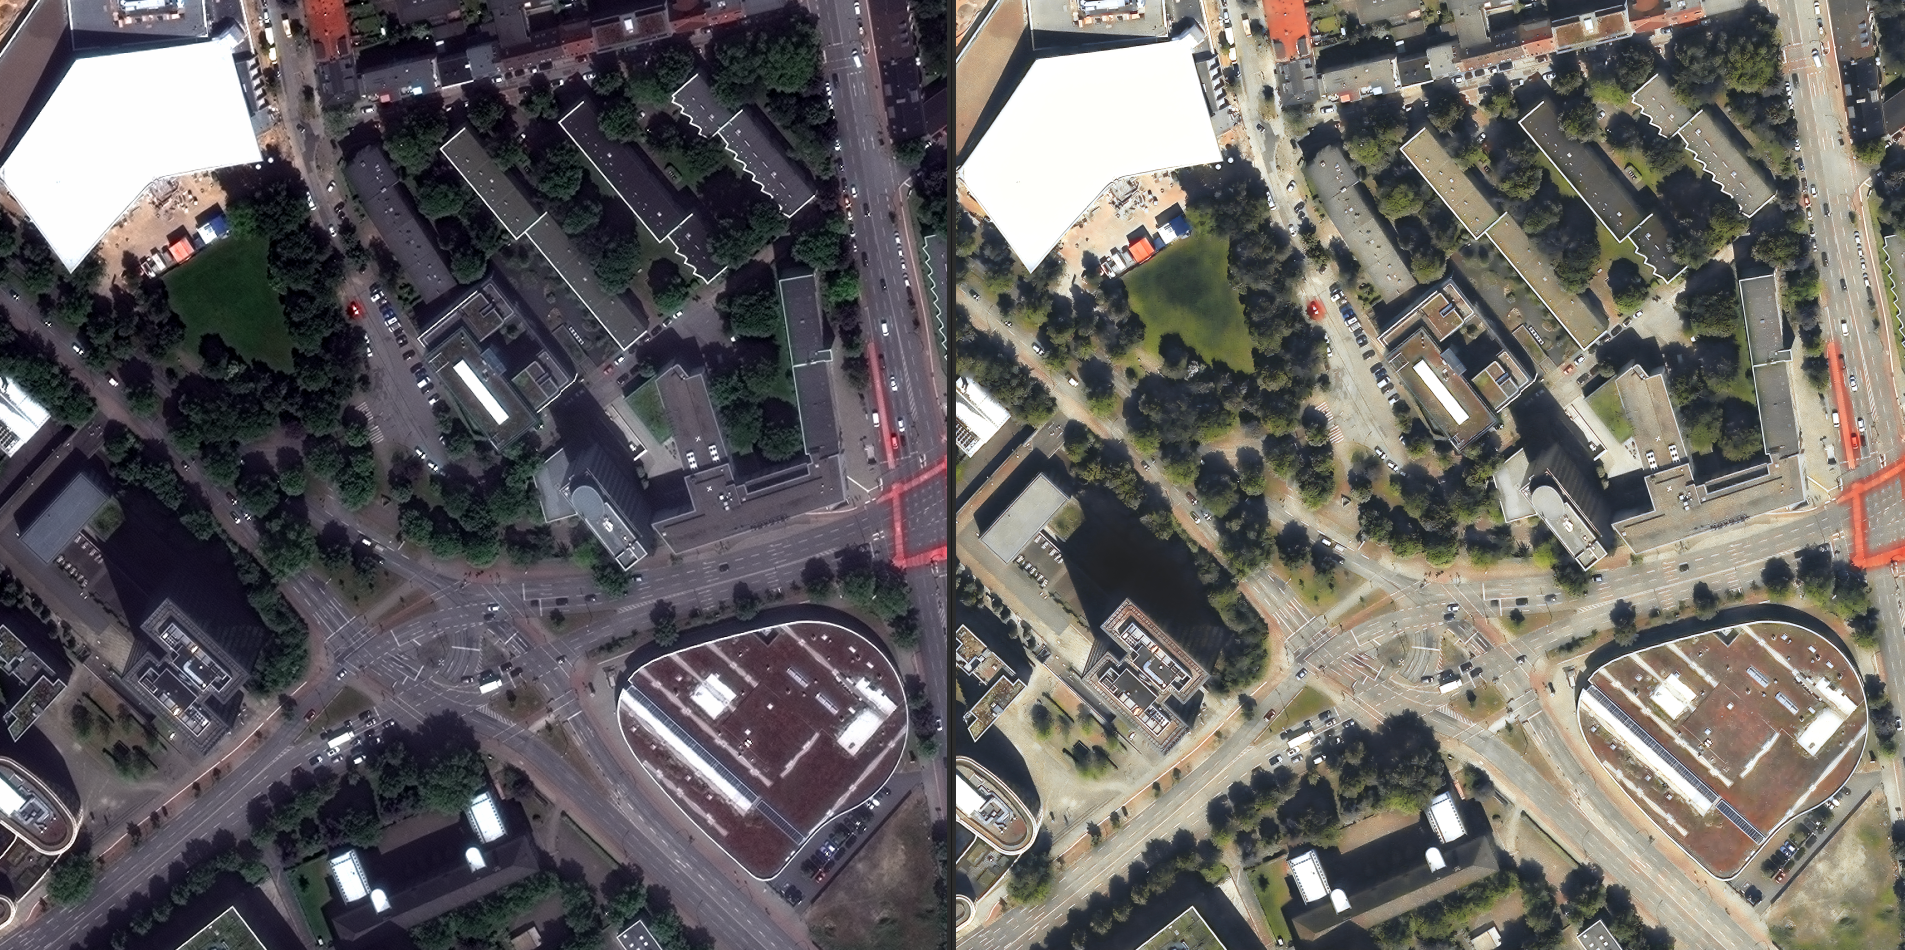
Step 1 — detect and delineate
A segmentation model labels every pixel as building or not, then a vectorisation step turns those blobs into crisp polygons with regularised, right-angled corners. This gives us accurate footprints — the foundation everything else stands on.

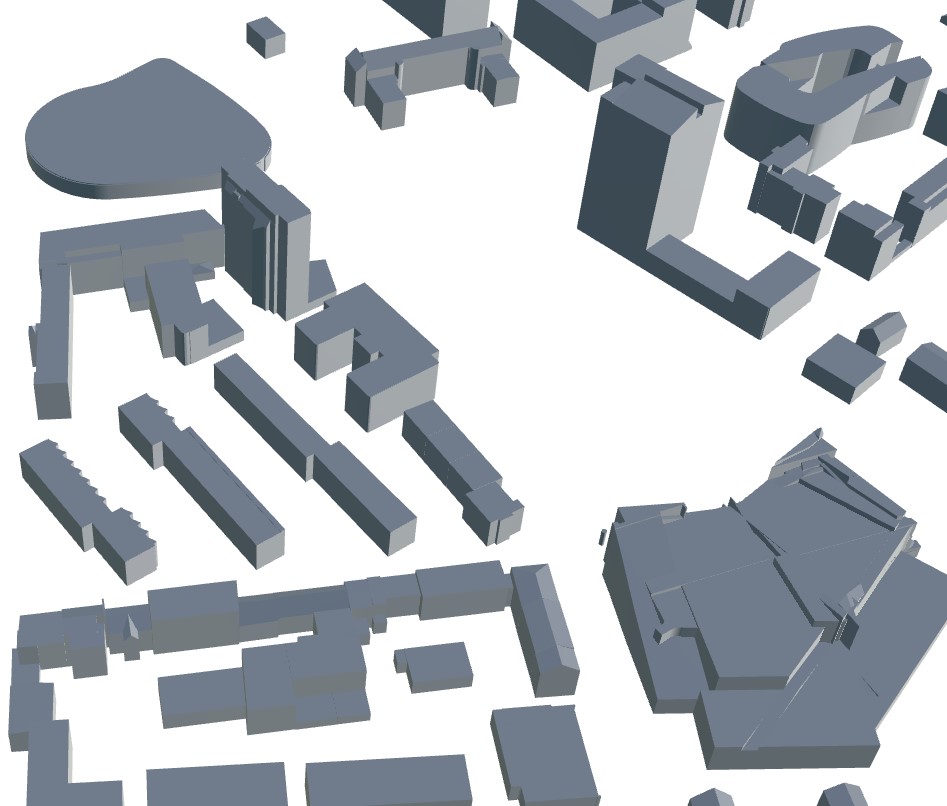
Step 2 — add height and roof form
From a digital surface model (photogrammetric or LiDAR) we recover each building's height and the shape of its roof — flat, gabled, hipped — and reconstruct the geometry. That is the jump from a flat footprint (LoD1) to a recognisable structure (LoD2).
Step 3 — classify and attribute
Finally we tag each building with attributes — use type, footprint area, storey estimate, roof material — so the model is not just geometry but a queryable dataset. The output exports to CityGML and glTF, ready for a digital twin, solar studies, or flood and noise modelling.
Want to see it on your own area? Send us an AOI.